Your Product Strategy in One Graph

The Value Curve model is a graph which shows instantly the strategic profile of a product.
The Value Curve is my favorite tool for driving innovation and/or scaling current business. Why? It’s easy to understand how to build it, easy to analyze and contains valuable information.
The Value Curve model is a graph which shows instantly the strategic profile of a product (or a company) in regards of competitors and across the targeted industry’s factors of competition.
It can be seen as a the foundation for your road map definition, your marketing plan guide lines, your selling process refinement, … in a easy to understand visual format as I said.
The concept of Value Curves was introduced in 1997 by academics W. Chan Kim and Renée Mauborgne. The concept was then expanded in their 2005 book “Blue Ocean Strategy”.
The main idea is that an effective strategy should focus on creating a new product and subsequent market with no competition (in contrast with trying to beat the competition in an existing market).
Because we are not all “Steve Jobs”, it is also a way to (re-)position a product in an existing market by filling gaps that the competition has missed; creating differentiators.
How to draw your Value Curve?
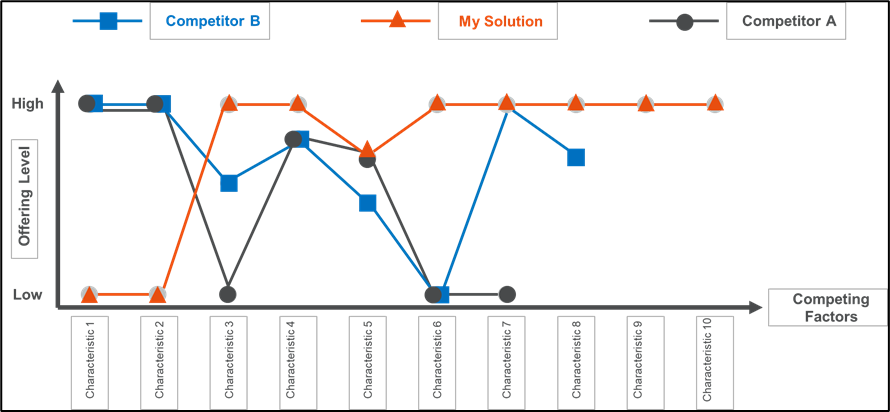
The Value Curve is a “simple” graph as illustrated in the adjacent figure.
Let’s take a deeper look at the 2 axis starting with the horizontal one.

In this axis you will put the factors that are important for your targeted customers, the need they want to address, the pains they want to relieve. It’s also the range of factors that you and your competitors compete on and invest in.
Set upping this list is critical. Indeed it implies a deep understanding of your customers needs and requires objectivity. It is not what “we think” but “what customers said” based on market evidences. I will note cover here the “Hidden Needs” (issues and problems that customers face but have not yet realized); this will be further addressed in another article.
The vertical axe represents the values or score for each of the factors listed in the horizontal one. For a specific factor being at the bottom of the axis would meant that this factor is not addressed by the solution when being at the top means that it’s a strong functionality of the evaluated solution.
Another critical step! It implies a certain level of knowledge of your competitors offering and an essential objectivity at the time to evaluate your own solution.
Your product and your main competitors’ one are now plot as curves in a single graph as shown in the above illustration. It’s now easy to analyze and to communicate across teams in your organization.
Identify your Unique Selling Point
With the Value Curve Model we get now a clear view of the Characteristics that Customers value and the ranking of our products and our competitors one by these criteria.
The visual comparison of the curves shows strengths and weaknesses for each of the solutions. You are able to asses what is your Unique Selling Point: the characteristic for which you are stronger than competition or even better, the characteristic you are the only one to cover.
It’s a guideline for your road map. Your objective is to defend this Unique Selling Point, to reinforce it. That way, competitors will struggle to keep up: by the time they’ve improved, you’ve already moved on to the next stage.
It’s also the foundation of your marketing plan. Once this Unique Selling Point is clearly identified make sure that the market knows about it!
The Four Strategical Actions coming out from Value Curve Model
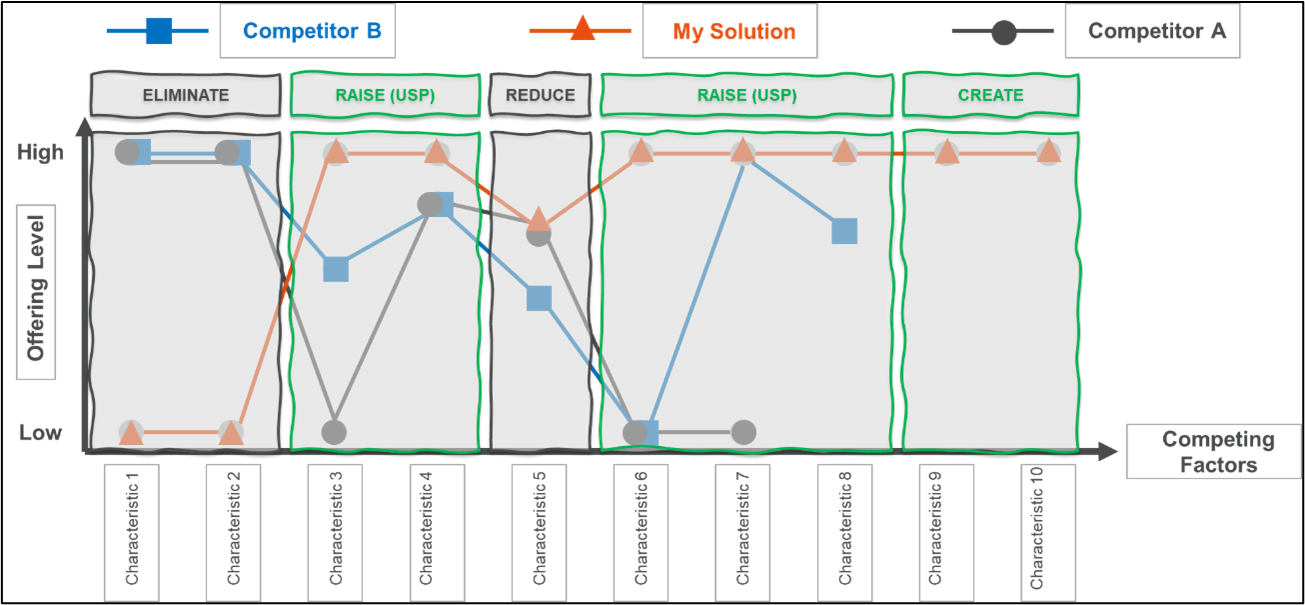
Going one step further the analysis of the Value Curve Model gives you the main directions for your innovation strategy. Being inspired by the Four Actions Framework it could be synthetized as following:
Eliminate. You can choose not to cover the Characteristics that are already well addressed by competitors (reshaping your solution, partnering with a third party, etc). It’s a way to reallocate resources and focus investments.
Reduce. For the Characteristics that are “must have” but don’t bring differentiators, you can decide to offer the minimum required (or here also partnering with a third party).
Raise. It refers to the reinforcement road map of the Unique Selling Point described previously.
Create. You customers’ conversations, your market analysis, your expertise, etc would let you discover new sources of value for buyers that are not currently offered by the industry. Once developed, they will be Characteristics your solution will be the only one to cover.

Conclusion
The Value Curves Model provides a useful framework for comparing your strategy against that of your competitors, by using a simple chart. This helps you focus sharply on the things that differentiate you from your competitors and develop a clear and easily explained value proposition.
The model is simple but drawing a Value Curve can take time. As we saw its relevancy is linked to an objective understanding of the customers’ needs and competitors positioning.
